Overview | Hardware | Data | Software | Further Reading | Contact Information
| Overview |
Calamari aims to explore the space of localization solutions in the sensor network domain, ie. it tries to give each sensor node in an ad-hoc wireless sensor network an (x,y) coordinate with respect to some known coordinate system. What makes localization a difficult problem in general is that almost every problem domain requires a completely different solution, from the hardware on up. For example, ubiquitous computing requires high security and high resolution indoors, military planning requires high security and low resolution outdoors, etc. Sensor networks generally require low security and low resolution but can only assume minimal infrastructure, hardware and deployment-time overhead. Calamari explores this scenario by assuming few or no anchor nodes, providing all nodes with identical hardware, and utilizing and developing multi-hop, ad-hoc localization algorithms.
There have been several focuses to the work on Calamari:
All of the data, Matlab simulation code, TinyOS code, and hardware specifications are freely available for further evaluation and analysis via this webpage.
| Hardware |
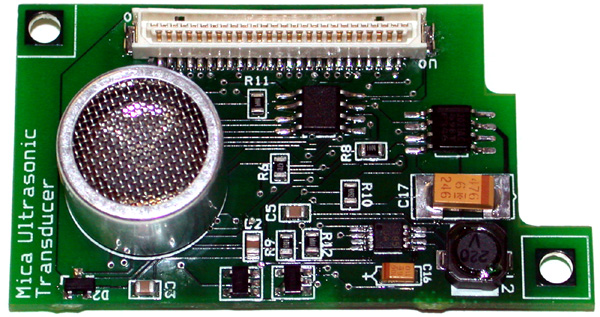
The latest hardware development includes an ultrasound ranging board in the Mica form factor. A 25Khz acoustic transducer is coupled with an Atmega8 microprocessor on a daughter board that connects to the Mica 51-pin connector. The Atmega 8 drives the transducer at an exact frequency and the analog comparator is used to detect the incoming signal. An interrupt line and the UART or I2C bus are used to communicate the time of flight reading to the Atmega128 on the Mica. Accurate measurements to within approximately 1 foot of error have been measured at up to 10 meters (30 feet) when the acoustic transducers are pointed at each other. Current work involves constructing a reflective cone to spread the acoustic energy in a plane to all neighboring nodes. This technique should be able to achieve similar accuracy at a reduced range, approximately 3 meters (9 feet). Other work involves building the board in the dot form factor.
The current mica form factor board is pictured below, with links to the schematics.
All other hardware used with Calamari is standard-issue Mica hardware: the RFM TR1000 and the Chipcon CC1000 radios, along with the sounder and microphone on the Mica sensor board. See the TinyOS hardware page for more details.
| Data |
RF Signal Strength vs. Distance/Radio
-- submitted 5-22-03 by Kamin Whitehouse
This dataset answers the following questions: If a packet is
received, with what signal strength will it likely be received at a given distance
and how much does that vary from radio to radio? This is important for
any algorithm that makes use of signal strength for predicting distance. Note that this data
is specific to the CC1000 433Mhz radio, which is used in the Mica2.
Acoustic time of flight vs.
Distance/Sounder/Mic
-- submitted 5-22-03 by Kamin Whitehouse
This dataset answers the following questions: If an acoustic chirp
is received, with what time of flight reading will it likely be received at a given distance
and how much does that vary from sounder/mic pair to sounder/mic pair? This is important for
any algorithm that makes use of acoustic time of flight for predicting distance. Note that this data
is specific to the sounder and microphone on the standard mica sensor board.
RF Signal Strength vs. Distance/Strength
-- submitted 10-15-01 by Rob
Szewczyk
This dataset answers the following questions: If a packet is
received, with what signal strength will it be received at a given distance when
it is sent with a given transmission strength? This is important for
any algorithm that makes use of signal strength for predicting distance. Note that this data
is specific to the TR1000 radio, which is used by TinyOS and SpotOn. The
potentiometer do not represent the entire spectrum of
transmission strength, but represent a good sample. Included graphs give
strong support for the use of the median rather than the mean or mode of the
RSSI.
RF Connectivity
vs. Distance/Strength-- submitted 10-04-01 by Alec
Woo
This dataset answers the following question: What
is the probability that a packet will be received at a given distance when it is
sent with a given transmission strength? This is important for
any algorithm that makes assumptions about connectivity. Note that this data
is specific to the TR1000 radio, which is used by TinyOS and SpotOn. The
potentiometer settings are meant to represent the entire spectrum of
transmission strengths that are meaningful over these distances. Data was
collected in an open parking lot in the evening when temperatures were near 60
F.
RF Signal
Strength and Noise Characterizations over Distance -- submitted 10-03-01 by Kamin
Whitehouse
This dataset tries to answer the following question: What is the
probability of measuring a certain signal strength and getting a certain number
of errors given the distance of the transmitter? This data is very
old and the actual measurements have been outdated, but it may still be useful
for the first-order graphical analysis. The data is grouped by distance,
transceiver, receiver, and position of the experiment, where the positions were
simply different corners of the lab. Each grouping is then
graphed. The data is formatted as raw packets, where all bytes are
constant (usually '0's) except for bytes 27 and 28, which represent the high and
low end bits of the signal strength respectively, and bytes 9 and 29 which are
junk. The error rates are simply deviations from the intended, constant
values of each byte. It is not recommended to use these signal strength
readings due to flaws in the sampling method.
RF
Characterization over Distance -- submitted 10-03-01 by Kamin
Whitehouse
This data tries to answer the following questions: What aspects of
an RF transmission can we use to infer the distance between transmitter and
receiver? The graphs illustrate the relation between distance and:
Signal Strength, Error, Packet Loss, Standard deviation of signal
strength. The graphs are followed by the actual packets received, grouped
by the mote that generated the data and by the location of the experiment.
However, it is not recommended to use this data beyond the first-order graphical
analysis due to serious flaws in the experimental design and sampling
method.
| Software |
Matlab Simulations
You can find the Matlab simulation code in the tinyos cvs in /tinyos-1.x/tools/matlab/contrib/kamin/localizationSimulation/. The code has three main parts:
To test the code out, add the enture localizationSimulation/ directory to your matlab path. Then run the lines
load isotropic
evaluate(t(1),'composition',1)
The first line loads an array of test cases "t" from the localizationSimulation/testcases/isotropic.mat file. The second command runs the "composition" algorithm from the localizationSimulation/algorithms/ directory on the first test case, and prints output. You should see the following screen appear:

The graph at the top shows the distribution of errors normalized to the length of the maximum radio range in the network topology. The bottom graph shows the actual network topology, where dots are nodes, gray lines indicate connectivity, and red X's indicate anchor nodes, nodes that know their own locations. The blue arrow on each mobile node indicates the error vector, ie. it points to the position where the algorithm things the node is.
To use the code more generally, use the "generateTestSuite.m" command in the localizationSimulation/testcases/ directory and any of the algorithms in the algorithms/ directory to test each algorithm against different characteristic networks.
TinyOS code
TinyOS code for calamari has been written using the Neighborhood abstraction and resides in the tinyos cvs in /minitasks/03/localization/. The top level configuration is called CalamariC.nc. To compile and run the code, run the following lines from the mentioned directory:
make pc
./build/pc/main.exe -gui 10
In another shell, type
java net/tinyos/sim/TinyViz
The first line makes the application for the simulator and the second line starts the simulator in gui mode with 10 nodes in the network. The third line starts the simulator gui, TinyViz. Activate the "Calamari" plugin in the TinyViz window, set the range and noise on the ranging technique and hit the ply button until the simulation starts. You should see a window that looks like this:

Each node displays a red ring around itself if it is an anchor node. The mobile nodes display a blue arrow indicating the current error vector and the circle around the arrow's tip indicates the node's own estimate of it's own noise on the location estimate.
Note that in the current implementation, the Simulator visualization is controlling the algorithm. To compile for a mica, simply switch the appropriate components such that
Ranging code
Acoustic time of flight code is available in the tinyos cvs in the /tinyos-1.x/lib/ranging/ directory. A node must install both TofChirpC.nc and TofEstimateDistanceC.nc. TofChirp must be told to periodically chirp. When a node with TofEstimateDistance hears that chirp, it will signal an event with the distance estimate.
Code that runs the Ultrasound device is availabe in the tinyos cvs in the /tinyos-1.x/tos/platform/atmega8 and /tinyos-1.x/tos/sensorboards/omnisound/. To install this code on an ultrasound board, go into the /tinyos-1.x/apps/TestOmnisound/TxRxController/ directory and type
make atmega8 install.0x7e
Ensure that the ultrasound device is plugged into your programming board. Then, switch it for the mica mote that you are programming the board for. Go into the /tinyos-1.x/apps/TestOmnisound/micaStub/ directory and type
make mica install
Your code must command the USoundTxrC.nc component to transmit and the USoundRxrC.nc component will signal an event with a distance estimate.
Calibration Code
The Joint Calibration method described below is quite simple to implement and is completely contained in the file in the tinyos cvs in /tinyos-1.x/tools/matlab/contrib/kamin/chipconRssi/analysis called "estimateCalibCoefficients.m". To understand the resulting calibration coefficients, look at or use the function "calibrateReading.m".
| Further Reading |
This document contains a summary of much of the research as of December '02:
Kamin Whitehouse. "The Design of Calamari: an Ad-hoc Localization System for Sensor Networks." Master's Thesis, University of California at Berkeley, 2002. (ps / pdf / bibtex )
One of the principle findings in Calamari was that calibration of ranging hardware is critical. Calibration and autocalibration techniques for both environmental differences and hardware variations are discussed in the following two papers:
Kamin Whitehouse, David Culler. "Macro-calibration in Sensor/Actuator Networks." Mobile Networks and Applications Journal (MONET), Special Issue on Wireless Sensor Networks. June, 2003. ACM Press. (ps / pdf / bibtex )
Kamin Whitehouse, David Culler. "Calibration as Parameter Estimation in Sensor Networks." In Proceedings of The First ACM International Workshop on Wireless Sensor Networks and Applications (WSNA'02). Atlanta, Georgia, September 28, 2002. ACM Press. (ps / pdf / bibtex )
The current TinyOS code relies heavily on the Neighborhood abstraction, which is described in paper submitted for puplication.
Neighborhood paper unavailable at this time.
Further calibration results, analysis of signal strength data, simulation tools and a new localization algorithm are presented in:
Xuanlong Nguyen and Tye Rattentbury. "Localization algorithms for sensor networks using RF signal strength." CS252 class project, UC Berkeley. May 2003. (ps).
An initial attempt at localization using radio signal strength on the UC Berkeley WeC and Rene sensor platforms is documented here:
Scott Klemmer, Sarah Waterson and Kamin Whitehouse. "Towards a Location-Based Context-Aware Sensor Infrastructure." CS262 and CS252 and CS294 class project, UC Berkeley. December 2000. (pdf )
| Contact Information |
Xiaofan Jiang (xjiang@uclink)